
Antibody Discovery Data Pipeline and Partner Portal for a Biotech Research Firm
Let's Connect
Overview
What we built
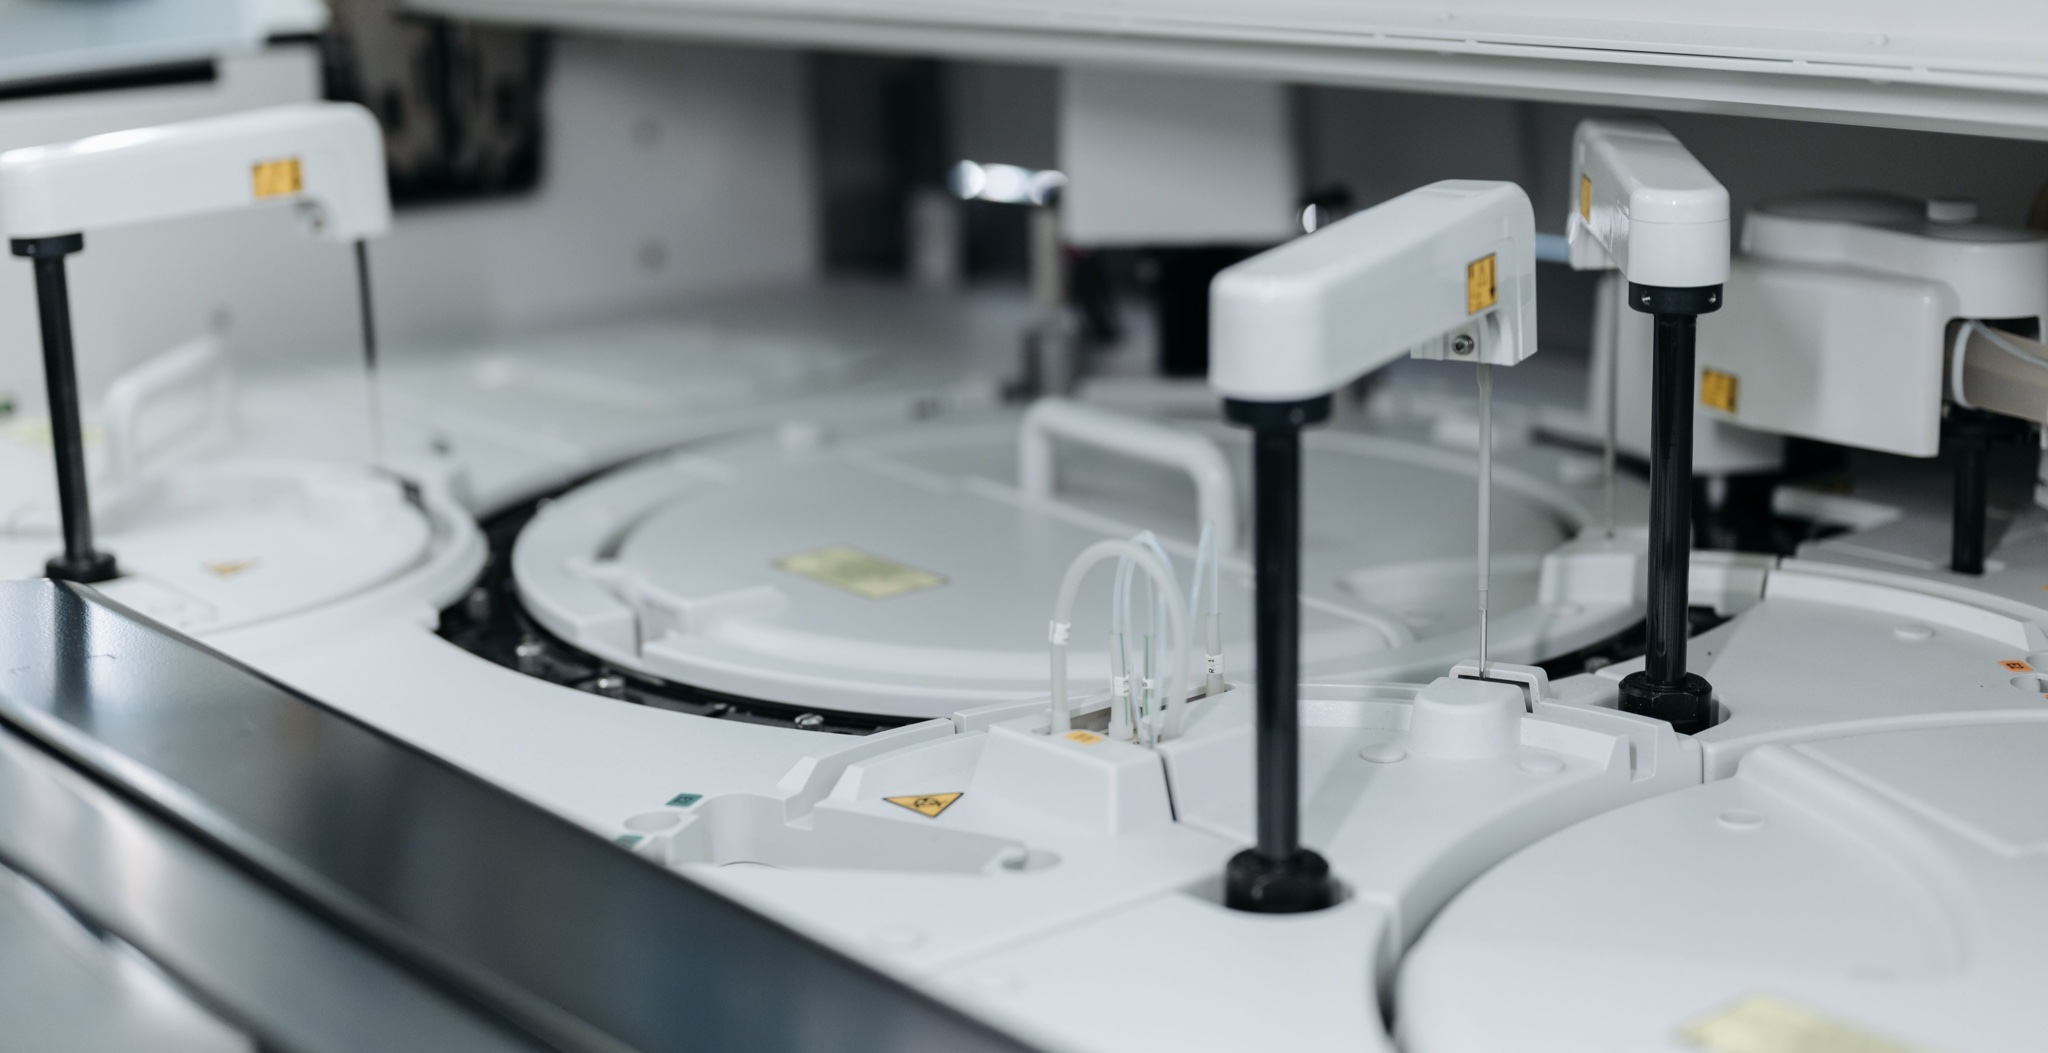
A discovery-stage biotech running more than 20 partner programmes had antibody screening data stranded on individual instrument workstations, with scientists retyping plate and sequence metadata by hand. We built an automated ingestion pipeline and partner portal that gets that data flowing without manual export.
In plain terms: a discovery-stage biotech running more than 20 partner programmes had antibody screening data trapped on whichever instrument workstation produced it. Scientists exported CSVs by hand, retyped plate and sequence metadata into spreadsheets, and partners waited weeks for a consolidated report on their own programme. Nobody could compare candidate performance across programmes without days of manual assembly, so the firm's own screening data was harder to use than it should have been.
We built an automated ingestion pipeline that pulls assay and sequencing outputs directly from instrument workstations into a central research data store, standardising plate, batch and sequence metadata as it lands. A partner portal sits on top, giving each partner per-programme dashboards, candidate comparison views and downloadable datasets through role-scoped access. Instrument-to-database latency fell from days of manual export to under 30 minutes, all 20+ partner programmes migrated onto the pipeline within 6 months, partner reporting moved from a weekly manual cadence to on-demand portal access, and scientist hours spent on data wrangling dropped by roughly 55% per programme.
The Problem
Screening data trapped in instruments
Running more than 20 partner programmes at once meant the biotech was generating antibody screening data continuously, but every instrument workstation held its own results in isolation. Nothing moved that data anywhere else automatically, so it sat wherever it was produced until a scientist manually pulled it out.
Getting that data usable meant real manual effort. Scientists exported CSVs by hand from each instrument, then retyped plate and sequence metadata into spreadsheets so results could be shared or compared. Partners waiting on their own programme's results had to wait weeks for a consolidated report, because assembling one meant collecting exports from wherever they had landed.
Comparing performance across programmes was harder still. With more than 20 programmes each generating data on their own workstations, seeing how one candidate compared to another meant days of manual assembly pulling exports together from across the firm, work that had to be repeated every time a real comparison was needed.
Data trapped on instruments
Antibody screening data stayed on whichever individual instrument workstation produced it, with nothing moving it anywhere else automatically.
Manual CSV exports
Scientists exported CSVs by hand and retyped plate and sequence metadata into spreadsheets before results could be shared with anyone.
Weeks-long partner waits
Partners waited weeks for a consolidated report on their own programme, because assembling one meant collecting manual exports from across instruments.
No cross-programme comparison
Comparing candidate performance across more than 20 programmes took days of manual assembly every time a real comparison was needed.
What it was costing them
Every week a partner waited on a consolidated report was a week screening data sat unused instead of informing the next decision on their programme. Scientists lost hours to exporting and retyping metadata by hand across more than 20 programmes, and without an easy way to compare candidates across programmes, the firm risked missing patterns its own screening data already contained.
The Solution
Automated pipeline with partner portal
We built an automated ingestion pipeline so screening data would no longer need a scientist to move it by hand. It pulls assay and sequencing outputs directly from instrument workstations into a central research data store, standardising plate, batch and sequence metadata on the way in so every programme's results land in the same consistent shape.
On top of that central store we built a partner portal, giving each of the firm's more than 20 partner programmes a place to see its own results without waiting on a manual report. Per-programme dashboards and candidate comparison views let partners and the firm's own scientists explore data directly, and downloadable datasets replace the CSVs that used to be assembled by hand.
Access was scoped from the start rather than added afterwards. Role-scoped access means each partner sees only their own programme through the portal, so consolidating data centrally did not mean exposing it more broadly than before, it just made each programme's own view immediate instead of delayed.
Key decisions
Automate instrument ingestion
The pipeline pulls assay and sequencing outputs directly from instrument workstations into the central data store, removing the manual CSV export step entirely.
Standardise metadata on the way in
Plate, batch and sequence metadata is standardised as data lands, so every programme's results share the same consistent structure.
Build per-programme dashboards
The partner portal gives each programme its own dashboard and candidate comparison view, replacing weeks-long waits for a manual consolidated report.
Offer downloadable datasets
Partners can download their own datasets directly from the portal instead of waiting for someone to assemble and send a report.
Scope access by partner
Role-scoped access ensures each partner sees only their own programme, keeping the centralised data store secure across more than 20 programmes.
Measurable Impact
What changed after launch
The pipeline closed the gap between an instrument producing a result and that result being usable. Instrument-to-database latency fell from days of manual export to under 30 minutes, and all 20+ partner programmes migrated onto the pipeline within 6 months, bringing every programme's data into the same automated flow.
Partners and scientists both felt the change. Partner reporting moved from a weekly manual cadence to on-demand portal access, so partners no longer wait on someone else's schedule to see their own results. Scientist hours spent on data wrangling dropped by roughly 55% per programme, freeing that time for screening work itself.
Instrument data flow
Days of manual CSV export per result
Under 30 minutes, fully automated
Programme onboarding
More than 20 programmes on manual process
All 20+ programmes migrated within 6 months
Partner reporting
Weekly manual cadence, consolidated by hand
On-demand access through the partner portal
Scientist data wrangling
Significant hours per programme spent wrangling data
Roughly 55% reduction per programme
Headline results
Instrument-to-database latency cut from days of manual export to under 30 minutes
All 20+ partner programmes migrated onto the pipeline within 6 months
Partner reporting moved from a weekly manual cadence to on-demand portal access
Scientist hours spent on data wrangling reduced by roughly 55% per programme
Tech & Tools Used
What powered the build
Every tool below earned its place in this engagement. Here is the part each one played.

Python (FastAPI)
Serves the ingestion pipeline's API layer, receiving assay and sequencing outputs from instrument workstations and exposing data to the partner portal.

Apache Airflow
Orchestrates the ingestion and standardisation jobs, coordinating each instrument's data through to the central research data store.

PostgreSQL
Stores standardised plate, batch and sequence metadata, giving the partner portal's dashboards and comparison views a consistent source to query.

Apache Parquet
Stores larger screening datasets in a columnar format, supporting the downloadable datasets and cross-programme comparison views in the portal.

dbt
Transforms ingested instrument outputs into the standardised metadata structure every programme's data shares once it lands in the central store.
AWS S3
Holds raw and processed screening outputs from every partner programme, backing the central research data store.

Next.js
Builds the partner portal, delivering per-programme dashboards, candidate comparison views and downloadable datasets to each partner.

Auth0
Handles authentication and role-scoped access for the partner portal, so each partner sees only their own programme.

Docker
Packages the ingestion and portal services as containers, keeping the pipeline consistent as more than 20 programmes were migrated onto it.

Grafana
Monitors pipeline health and instrument-to-database latency, giving the team visibility into how quickly new screening data becomes usable.
Ready to Build your Life Sciences & Med Devices Business with Data Engineering for AI
Ask Byte
Ask Byte
Typically replies instantly
just Now
Hi! I'm OrganByte's assistant. How can I help you today?
AI-generated content may be incorrect